| ** | Latin American Journal of Clinical Sciences and Medical Technology is an open access magazine. To read all published articles and materials you just need to register Registration is free of charge. Register now If you already have registered please Log In | ** |


aDepartamento de Gastroenterología y Unidad de Trasplante Hepático, Instituto Nacional de Ciencias Médicas y Nutrición “Salvador Zubirán”, Mexico City, Mexico; bDepartamento de Neurología y Psiquiatría, Instituto Nacional de Ciencias Médicas y Nutrición “Salvador Zubirán”, Mexico City, Mexico; cEscuela de Medicina y Ciencias de la Salud, Tecnológico de Monterrey, Monterrey, Nuevo León, Mexico; dDepartamento de Trasplante, Instituto Nacional de Ciencias Médicas y Nutrición “Salvador Zubirán”, Mexico City, Mexico; eDepartamento de Anestesiología y Medicina Perioperatoria, Instituto Nacional de Ciencias Médicas y Nutrición “Salvador Zubirán”, Mexico City, Mexico.
Corresponding Author: , . Telephone number: ; e-mail: drinter77@gmail.com

Lat Am J Clin Sci Med Technol. 2020 Mar;2:18-24.
Received: September 9th, 2019.
Accepted: March 23rd, 2020.
Published: March 30th, 2020.
Views: 866
Downloads: 16

Introduction. Eradication rates of hepatitis C virus (HCV) infection is likely to rise after liver transplantation (LT). We aimed to evaluate the clinical role of a simple method for calcineurin inhibitors (CNI) adjustment in post-LT patients receiving paritaprevir/ritonavir/ombitasvir/dasabuvir and ribavirin (3D scheme). Material and methods. We included post-LT adult patients between 2014 and 2017. All selected subjects had at least a 12-month follow-up receiving a stable dose of a CNI. All patients had HCV-1 infection, no liver cirrhosis and received the 3D scheme for 24 weeks. Serial blood concentration measurements of immunosuppressant drugs were obtained. CNI dose was adjusted since 3D scheme initiation and during follow-up until adequate levels were obtained. Results. A total of 10 LT patients (mean age 58.7±11.26 years, 60% women), out of LT 22, received the 3D regime. Tacrolimus was used in 9 patients: four patients received a dose of 0.5 mg every 10 days and 5 received doses of 0.25 mg every 5 days (mean levels, 9.07±5.56 ng/mL). The trough concentration (Ctrough) was 2 ng/mL and the maximum concentration (Cmax) was 30 ng/mL. Only one patient was treated with cyclosporine (mean blood levels of 152.85±54.55 ng/mL). All cases exhibited a sustained viral response. Discussion and conclusions. It is possible to adjust CNI in LT patients under the 3D regime, with high response rates. Low CNI doses are required to avoid toxicity and side effects in HCV patients receiving protease inhibitors.
Introducción. Altas tasas de erradicación de la infección por el virus de la hepatitis C (VHC) son posibles después de trasplante hepático (TH). Nuestro objetivo fue evaluar un método simple para el ajuste de inhibidores de calcineurina (ICN) en pacientes post-TH que reciben paritaprevir/ritonavir/ombitasvir/dasabuvir y rivabirina (esquema 3D). Material y métodos. Incluimos pacientes adultos post-TH entre 2014 y 2017. Todos tuvieron al menos 12 meses de seguimiento y recibieron una dosis estable de un ICN. Todos tenían infección por VHC-1, sin cirrosis hepática y recibieron el esquema 3D durante 24 semanas. Se obtuvieron mediciones seriadas de la concentración sanguínea de fármacos inmunosupresores. La dosis de ICN se ajustó desde el inicio del esquema 3D y durante el seguimiento hasta que se obtuvieron los niveles adecuados. Resultados. De 22 pacientes con TH (edad media 58.7 ± 11.26 años, 60% mujeres) 10 recibieron el régimen 3D. Tacrolimus se utilizó en 9 pacientes: 4 recibieron 0.5 mg cada 10 días y 5 recibieron 0.25 mg cada 5 días (niveles medios, 9.07 ± 5.56 ng/mL). La concentración mínima (Ctrough) fue de 2 ng/mL y la concentración máxima (Cmax) fue de 30 ng/mL. Sólo un paciente fue tratado con ciclosporina (niveles sanguíneos medios de 152.85±54.55 ng/mL). Todos los casos exhibieron respuesta viral sostenida. Discusión y conclusiones. Es posible ajustar ICN en pacientes con TH en régimen 3D, con altas tasas de respuesta. Se requieren dosis bajas de ICN para evitar toxicidad y efectos secundarios en pacientes con VHC que reciben inhibidores de proteasa.
Nowadays, liver transplantation (LT) is considered a feasible cure for end-stage liver disease (ESLD), and its survival has been estimated to be close to 71% at 5 years and 60% at 10 years.1,2 Recurrence of Hepatitis C virus (HCV) infection in the post-transplant period is almost universal3-5; that is to say, up to 10-30% of patients developing cirrhosis 5 years after LT.6 Nevertheless, new direct-acting anti-HCV treatments have become available and they reach eradication rates above 87-97%.7 With the paritaprevir/ritonavir/ombitasvir/dasabuvir and ribavirin (3D) scheme, a sustained viral response (SVR) of 97% has been reported (CORAL-1 study), with no associated rejection episodes and acceptable tolerability.5,7
Calcineurin inhibitors (CNI) such as tacrolimus (TAC) and cyclosporine A (CsA) are considered the pillars of immunosuppressive therapy in LT recipients.4,8,9 TAC is a potent inhibitor of CYP3A and glycoprotein P (P-gp), while CsA inhibits CYP3A, P-gp, and the organic anion transport protein (OATP)-1B1.9 Both mechanisms are associated with different interactions, and as a result, drug blood levels are required for close monitoring.10 The 3D regime can also induce CYP3A4 and can inhibit P-gp and OATP-1B1; thus, potentially noxious drug interactions should be anticipated. Therefore, a dose reduction of CNI can be established to reduce toxicity; however, no recommendations or algorithms are available for LT patients under advanced anti-HCV therapy.
Even though different treatment modalities are described in the guidelines for eradicating HCV infection7,11, access to advanced anti-HCV therapies is not universal. In Mexico, only some regimes are available. We aimed to evaluate the required dose adjustment of CNI in patients on HCV treatment under the 3D regime.
This is a prospective, observational study. We included adult patients from Unidad de Trasplante Hepático at Instituto Nacional de Ciencias Médicas y Nutrición “Salvador Zubirán”. Patients were selected and invited to participate between January 2014 and April 2017. All patients were HCV genotype 1 and were receiving a stable CNI dose. Participants were followed in the clinic for at least one year after transplantation. A FibroScan® or biopsy result ≤ F2 was required. All patients with other genotypes, co-infection with human immunodeficiency virus (HIV), hepatitis B, re-transplantation or multivisceral transplantation were excluded. Patients under other therapeutic regimens were not included. All patients who agreed to participate in the study signed an informed consent form and agreed to be closely monitored throughout the treatment. The Institutional Review Board and Ethics Committee of our center approved the study.
Clinical records were reviewed to collect demographic data, risk factors, comorbidities, clinical presentation, and laboratory data. Research data was extracted into a standardized and structured research format. In all patients, pharmacological interactions were reviewed and adjusted before the initiation of antiviral therapy. TAC or CsA levels in the previous three visits were reviewed to determine the use of a stable drug dose; dosages were adjusted as suggested by Bradi et al.5 The trough concentration (Ctrough) was determined before treatment initiation to confirm that levels were within adequate ranges. Necessary drug adjustments were applied if necessary, and the patient was re-evaluated at a later date.
All patients received ribavirin and 3D for 24 weeks. TAC was initiated at a dose of 0.5 mg every 7 days or 0.25 mg every 5 days. In the patients on CsA, the total dose was decreased by 1/5 and administered once daily during the morning. The CNI was ingested 1 hour before 3D, in the morning. According to previous studies, TAC dose half-life would increase up to 10 days and levels would stabilize at 5-6 week5; CsA, half-life would increase up to 25 hours and would stabilize by day 15.5
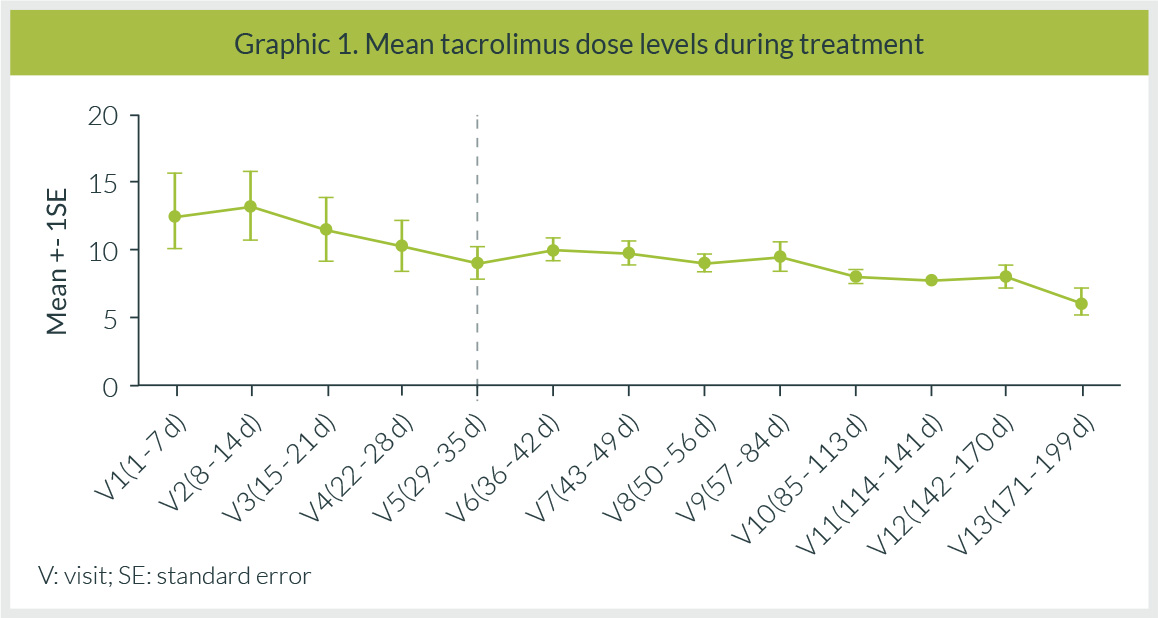
Patients were evaluated as follows: during the first week of follow-up (visit 1), until three CNI levels were determined (if needed), and they were subsequently measured weekly (visits 2-8) until the eighth week. Thereafter, levels were determined every 4 weeks (visits 9-12) until the end of treatment. After completing HCV therapy, patients were re-evaluated to readjust the CNI dosage (visit 13). CNI levels were measured by chemiluminescent microparticle immunoassay (CMIA). During each patient evaluation, CNI levels were performed. If any change was needed or if a patient needed an unscheduled visit, phone contact was performed.
Statistical analysis
Results are reported with central tendency statistics and the mean ± standard deviation and interquartile range when appropriate. Pharmacokinetic analysis was performed for both TAC and CsA. Dose and blood concentration data were analyzed globally. A mono-compartmental model with oral absorption was used.
Ten patients, out of a total of 22 who received LT during the period, had HCV infection and received the 3D regimen. The general characteristics of the patients are shown in Table 1. Nine patients (90%) received TAC and 1 (10%) CsA. Two patients had a history of grade 2 rejection episodes. No patient developed a rejection episode during the 3D regimen. The mean body weight was 55.76 ± 28.92 kg. The time between LT to treatment initiation was 27.50 months (21.50-36.25 months).
| Table 1. Characteristics of the patients. | |||
|---|---|---|---|
| Global (n = 10) | Tacrolimus (n = 9) | Cyclosporine (n = 1) | |
| Age, median (IQR), years | 60 (50.25 - 69.25) | 61 (37 - 70) | 57 (-) |
Gender, n (%) | |||
| Male | 4 (40) | 4 (44.4) | 0 |
| Female | 6 (60) | 5 (55.5) | 1 (100) |
Genotype, n (%) | |||
| 1a | 3 (30) | 3 (33.3) | 0 |
| 1b | 5 (50) | 5 (55.5) | 0 |
| 1a / b | 2 (20) | 1 (11.11) | 1 (100) |
| Transfusion, n (%) | 7 (70) | 7 (77.78) | 0 |
Previous treatment, n (%) | |||
| Naïve | 8 (80) | 7 (77.78) | 1 (100) |
| Weight, median (IQR), kg | 63.80 (57.63 - 75.38) | 65.84 (47 - 89) | 73 (-) |
In the TAC group, 4 patients received an initial dose of 0.5 mg every 7 days, and 5 patients received a dose of 0.25 mg every 5 days. The patient on CsA was administered 1/5 of the usual dose. After 24 hours of initiating HCV treatment in the 0.5 mg TAC dose group, an increase between 74.7 and 111% in TAC levels were documented. The dose was adjusted and administered every 10 days. Mean levels during the whole treatment period were 9.07 ± 5.56 ng/mL (Figure 1). The Ctrough during the study period was 2 ng/mL and the maximum observed concentration (Cmax) was 30 ng/mL (Table 2).
Although the CsA dose was decreased to 10 mg once daily in the only patient receiving CsA, an increase of 400% in blood levels was detected. The drug was withdrawn for 96 hours and once adequate levels were obtained, the CNI was reinitiated at 1/5 of the pre-treatment dose. At follow-up, mean levels were 152.85 ± 54.55 ng/mL, the Ctrough during the study period was 66.90 ng/mL and the Cmax was 476.70 ng/mL (Table 2).
| Table 2. Pharmacokinetic parameters of the patients under treatment. | ||||
|---|---|---|---|---|
| Parameter, mean | Cyclosporine 20 mg | Tacrolimus 0.5 mg | Tacrolimus 0.25 mg | |
| AUC∞ * (ng/mL) | 6151.98 | 615.57 | 732.83 | |
| Ctrough * (ng/mL) | 0.85 | 6.04 | 3.30 | |
| Cmax * (ng/mL) | 84.9 | 15.00 | 9.50 | |
| Cyclosporine 20 mg + 3D | Tacrolimus 0.5 mg + 3D | Tacrolimus 0.25 mg + 3D | ||
| AUC∞ treatment (ng/mL) | 25587.72 | 1421.54 | 1468.77 | |
| Cmax treatment (ng/mL) | 476.70 | 27.90 | 30.00 | |
| Ctrough treatment (ng/mL) | 66.90 | 2.00 | 2.60 | |
| Cmax/D treatment (ng/mL/mg) | 23.834 | 13.95 | 15 | |
| Ctrough/D treatment (ng/mL/mg) | 3.35 | 1 | 0.8 | |
| Ctrough: trough concentration. Cthrough/D: trough concentration/normalized dose. AUC∞: area under the concentration-time curve (infinite time). Cmax: maximum observed concentration. Cmax/D: maximum concentration, normalized dose. *Patients with dose prior to adjustment for 3D. | ||||
In our cohort of patients, no adverse effects associated with 3D treatment were seen. The ribavirin dose was adjusted during treatment according to the development of adverse effects. In 30% of patients, it was withdrawn for an average of 8 weeks. At the end of treatment, all patients had a negative viral load and an SVR24 was achieved in all patients. Viral load monitoring and biochemical liver function tests of the patients are reported. (Table 3).
| Table 3. Laboratory data of patients. | ||||||||||||||||||||
|---|---|---|---|---|---|---|---|---|---|---|---|---|---|---|---|---|---|---|---|---|
| Patient | 1 | 2 | 3 | 4 | 5 | 6 | 7 | 8 | 9 | 10 | ||||||||||
| Pre-T | EOT | Pre-T | EOT | Pre-T | EOT | Pre-T | EOT | Pre-T | EOT | Pre-T | EOT | Pre-T | EOT | Pre-T | EOT | Pre-T | EOT | Pre-T | EOT | |
| TB, mg/d | 0.56 | 0.91 | 1.19 | 0.92 | 0.98 | 0.87 | 0.71 | 0.72 | 0.36 | 0.21 | 1.11 | 1.87 | 0.65 | 0.95 | 0.50 | 0.27 | 1.05 | 0.99 | 0.56 | 0.34 |
| ALT, U/L | 214 | 8 | 162 | 45 | 24 | 7 | 154 | 20 | 29 | 9 | 32 | 8 | 31 | 10 | 32 | 4 | 311 | 51 | 48 | 12 |
| AST, U/L | 340 | 13 | 105 | 27 | 23 | 12 | 110 | 14 | 44 | 11 | 25 | 16 | 31 | 12 | 29 | 12 | 259 | 33 | 41 | 12 |
| AP, U/L | 125 | 89 | 229 | 245 | 122 | 124 | 94 | 100 | 137 | 75 | 133 | 82 | 81 | 81 | 137 | 100 | 876 | 293 | 77 | 83 |
| GGT, U/L | 305 | 12 | 645 | 93 | 152 | 32 | 38 | 15 | 106 | 13 | 58 | 16 | 54 | 10 | 100 | 12 | 1355 | 343 | 75 | 19 |
| Alb, g/dL | 4.30 | 4.5 | 4.2 | 4.2 | 3.90 | 4.5 | 4.2 | 4.5 | 3.7 | 2.5 | 4.3 | 4.5 | 4.40 | 4.3 | 4.5 | 3.6 | 4.5 | 4.7 | 4.10 | 4.32 |
| Viral load UI/mL | 2081294 Log 6.32 | ND | 372516 Log 5.57 | ND | 171815 Log 5.24 | ND | 527962 Log 5.72 | ND | 766952 Log 5.88 | ND | 189980 Log 5.28 | ND | 2532638 Log 6.4 | ND | 1242060 Log 6.09 | ND | 8698 Log 3.94 | ND | 245575 Log 5.39 | ND |
| SVR24 viral load UI/mL | ND | ND | ND | ND | ND | ND | ND | ND | ND | ND | ||||||||||
| 1-year viral load UI/mL | ND | ND | ND | ND | ND | ND | ND | ND | ND | ND | ||||||||||
| TB: Total Bilirubin. ALT: Alanine aminotransferase. AST: Aspartate aminotransferase. GGT: Gamma-Glutamyl Transferase. AP: Alkaline Phosphatase. Alb: Albumin. Pre-T: Pre-treatment. EOT: End of treatment. ND: Non-detected. SVR24: Sustained viral response week 24. | ||||||||||||||||||||
HCV recurrence after LT is universal.12-15 In some patients, it follows an accelerated course that leads to early allograft failure whereas, in others, it can promote the development of significant fibrosis for years. Previous studies have documented a more aggressive course in some LT recipients, leading to cirrhosis within 5 years.12
Antiviral therapy can improve significantly the patients’ outcome, so timely treatment is key in this population. Ideally, antiviral therapy should be initiated before LT so that graft re-infection can be limited, but since this is not always feasible, special measures must be taken in post-LT patients, particularly those on drug interactions with CNI that could potentially preclude or limit their use.
At the moment, multiple treatment options are available with high SVR in LT patients, but in Mexico, only a few exist and they are not universally accessible. Our experience with the 3D regimen was taken from 10 patients, most of them on TAC immunosuppression. Particularly due to potential drug interactions with the protease inhibitor paritaprevir, CNI dose adjustment could be needed with close monitoring.
All our patients met treatment criteria according to the CORAL-1 study12, and the period between LT to treatment initiation was 27.5 months, which is even higher than the 12 months described in the CORAL-1 study. That allowed us to be certain that the patients were receiving stable immunosuppression doses before initiating 3D treatment.
First, the TAC dose was administered at 0.5 mg every 7 days, as reported initially by Badri et al.6; however, we found that our patients required less frequent dosing and it was prolonged to every 10 days and even 17 days, leading to more stable control. When using 0.25 mg, the drug was initially administered twice a week, as suggested in the study by Bradi et al.6, but in our cohort it was later adjusted to 5-day intervals, yielding better results. A subsequent publication including 34 patients with LT and 3D treatment, as well as a pharmacokinetic model5, agreed with our findings, and the adjustment was maintained.
In the case treated with CsA, 1/5 of the total daily dose was administered once daily; however, blood levels were unexpectedly high, so the dose was administered after 72 h initially and thereafter, and the patient was appropriately controlled.
Although fewer doses were required, we achieved optimal TAC levels and no rejection episodes were documented. We are aware of the high Cmax reported but it was comparable with those reported by Bradi et al.5 In our study, no serious adverse reactions were observed during the follow-up and levels remained stable at high ranges for 6 weeks. Subsequently, an established dose of 0.25 mg was administered, follow-up was uneventful and there was no detrimental effect on the SVR12.
As expected, the most commonly observed side effect associated with ribavirin use was the development of anemia. In our population, the drug required withdrawal in 30% (n=3) of cases, for up to 4 weeks. This strategy was not associated with poor treatment response and did not affect the SVR12.
We propose that this immunosuppressing regime is safe, but it requires closer surveillance and lower doses of CNIs for Mexican patients. In this cohort, a followed-up over 28 months after LT and an SVR12 of 100% was documented. At the moment, SVR24 is 100% and SVR 1-year after follow-up was 100%.
Our study has some limitations that should be discussed. We are aware of the small number of patients included in this study and that the scheme is currently not considered ideal due to the interactions reported with CNI, but in countries like Mexico, where there is limited access to other DAA schemes, this treatment could be considered a feasible option that requires adaptation and surveillance.
In conclusion, CNI adjustment is considered patient-specific and is guided by observed blood levels and the elapsed period after LT. In patients under 3D, adjustment is possible and with no associated serious adverse effects. All patients require close monitoring, but stable drug levels are evident by the fifth week after adjustment. The 3D scheme, though not universally recommended nowadays, is a possible therapeutic regime in LT patients receiving CNIs, with adequate dose adjustment and monitoring. In the present study, we tested a successful approach to the problem of prescribing an anti-VHC 3D scheme in patients needing immunosuppression with CNIs.
The authors have no relevant conflicts of interest to declare.
This registry received no funding.
| 1. | Carenco C, Assenat E, Faure S, Duny Y, Danan G, Bismuth M, et al. Tacrolimus and the risk of solid cancers after liver transplant: A dose effect relationship. Am J Transplant [Internet]. 2015 Mar 1 [cited 2020 Mar 18];15(3):678–86. Available from: http://www.ncbi.nlm.nih.gov/pubmed/25648361 |
| 2. | Wimmer CD, Angele MK, Schwarz B, Pratschke S, Rentsch M, Khandoga A, et al. Impact of cyclosporine versus tacrolimus on the incidence of de novo malignancy following liver transplantation: a single center experience with 609 patients. Transpl Int [Internet]. 2013 Oct [cited 2020 Mar 18];26(10):999–1006. Available from: http://www.ncbi.nlm.nih.gov/pubmed/23952102 |
| 3. | Bhamidimarri KR, Satapathy SK, Martin P. Hepatitis C virus and liver transplantation. Gastroenterol Hepatol. 2017 Apr 1;13(4):214–20. |
| 4. | Burra P, Burroughs A, Graziadei I, Pirenne J, Valdecasas JC, Muiesan P, et al. EASL Clinical Practice Guidelines: Liver transplantation. J Hepatol. 2016 Feb 1;64(2):433–85. |
| 5. | Badri PS, Parikh A, Coakley EP, Ding B, Awni WM, Dutta S, et al. Pharmacokinetics of Tacrolimus and Cyclosporine in Liver Transplant Recipients Receiving 3 Direct-Acting Antivirals as Treatment for Hepatitis C Infection. Ther Drug Monit [Internet]. 2016 Oct 1 [cited 2020 Mar 18];38(5):640–5. Available from: http://www.ncbi.nlm.nih.gov/pubmed/27310199 |
| 6. | Badri P, Dutta S, Coakley E, Cohen D, Ding B, Podsadecki T, et al. Pharmacokinetics and dose recommendations for cyclosporine and tacrolimus when coadministered with ABT-450, ombitasvir, and dasabuvir. Am J Transplant [Internet]. 2015 May 1 [cited 2020 Mar 18];15(5):1313–22. Available from: http://www.ncbi.nlm.nih.gov/pubmed/25708713 |
| 7. | Belli LS, Duvoux C, Berenguer M, Berg T, Coilly A, Colle I, et al. ELITA consensus statements on the use of DAAs in liver transplant candidates and recipients. J Hepatol [Internet]. 2017 Sep 1 [cited 2020 Mar 18];67(3):585–602. Available from: http://www.ncbi.nlm.nih.gov/pubmed/28323126 |
| 8. | Venitz J, Zack J, Gillies H, Allard M, Regnault J, Dufton C. Clinical pharmacokinetics and drug-drug interactions of endothelin receptor antagonists in pulmonary arterial hypertension. J Clin Pharmacol [Internet]. 2012 Dec [cited 2020 Mar 18];52(12):1784–805. Available from: http://www.ncbi.nlm.nih.gov/pubmed/22205719 |
| 9. | Krisl JC, Doan VP. Chemotherapy and Transplantation: The Role of Immunosuppression in Malignancy and a Review of Antineoplastic Agents in Solid Organ Transplant Recipients. Vol. 17, American Journal of Transplantation. Blackwell Publishing Ltd; 2017. p. 1974–91. |
| 10. | Early CR, Park JM, Dorsch MP, Pogue KT, Hanigan SM. Effect of metronidazole use on tacrolimus concentrations in transplant patients treated for Clostridium difficile. Transpl Infect Dis [Internet]. 2016 Oct 1 [cited 2020 Mar 18];18(5):714–20. Available from: http://www.ncbi.nlm.nih.gov/pubmed/27501504 |
| 11. | Kwo PY, Badshah MB. New hepatitis C virus therapies: drug classes and metabolism, drug interactions relevant in the transplant settings, drug options in decompensated cirrhosis, and drug options in end-stage renal disease. Curr Opin Organ Transplant [Internet]. 2015 Jun 1 [cited 2020 Mar 18];20(3):235–41. Available from: http://www.ncbi.nlm.nih.gov/pubmed/25944238 |
| 12. | Kwo PY, Mantry PS, Coakley E, Te HS, Vargas HE, Brown R, et al. An interferon-free antiviral regimen for HCV after liver transplantation. N Engl J Med [Internet]. 2014 Dec 18 [cited 2020 Mar 18];371(25):2375–82. Available from: http://www.ncbi.nlm.nih.gov/pubmed/25386767 |
| 13. | Pardo F, Pons JA, Castells L, Colmenero J, Gómez MÁ, Lladó L, et al. VI consensus document by the Spanish Liver Transplantation Society. Gastroenterol Hepatol. 2018 Jun 1;41(6):406–21. |
| 14. | Rubín Suárez A, Bilbao Aguirre I, Fernández-Castroagudin J, Pons Miñano JA, Salcedo Plaza M, Varo Pérez E, et al. Recommendations of everolimus use in liver transplant. Gastroenterol Hepatol [Internet]. 2017 Nov 1 [cited 2020 Mar 18];40(9):629–40. Available from: http://www.ncbi.nlm.nih.gov/pubmed/28743539 |
| 15. | Llovet L-P, Rodríguez-Tajes S, Londoño M-C. [Treatment of hepatitis C before and after liver transplantation]. Gastroenterol Hepatol [Internet]. 2016 May 1 [cited 2020 Mar 18];39(5):344–51. Available from: http://www.ncbi.nlm.nih.gov/pubmed/26547614 |
All Rights Reserved® 2019
Latin American Journal of Clinical Sciences and Medical Technology,Publicación contínua • Editor responsable: Gilberto Castañeda Hernández. • Reserva de Derechos al Uso Exclusivo: 04-2019-062013242000-203; ISSN: 2683-2291; ambos otorgados por el Instituto Nacional del Derecho de Autor. • Responsable de la última actualización de este número, Web Master Hunahpú Velázquez Martínez,
Calle Profesor Miguel Serrano #8, Col. Del Valle, Alcaldía Benito Juárez, CP 03100, Ciudad de México, México. Número telefónico: 55 5405 1396 • Fecha de última modificación, 28 de agosto de 2024.
All Rights Reserved® 2019
Publicación contínua • Editor responsable: Gilberto Castañeda Hernández. • Reserva de Derechos al Uso Exclusivo: 04-2019-062013242000-203; ISSN: 2683-2291; ambos otorgados por el Instituto Nacional del Derecho de Autor. • Responsable de la última actualización de este número, Web Master Hunahpú Velázquez Martínez,
Calle Profesor Miguel Serrano #8, Col. Del Valle, Alcaldía Benito Juárez, CP 03100, Ciudad de México, México. Número telefónico: 55 5405 1396 • Fecha de última modificación, 28 de agosto de 2024.